Iowa's Fish Kill Database and the Story Behind the Numbers
posted
by Kean Roberts on Friday, August 28, 2026
The Iowa DNR’s Fish Kill Database is one of the state’s most revealing public records of water pollution. It holds 1,026 fish kill investigations dating back to 1981, documenting where fish died, when they died, what investigators believe killed them, and roughly how many were lost. Together, the reported events account for 13.5 million dead fish.
But the database is more than a list of dead fish. It is a record of what happens when something goes wrong in Iowa’s waters—and a tool Iowans can use to see where, when and how often it happens.
Every investigation begins the same way: someone notices something wrong in the water and reports it to the DNR. The agency investigates and adds what it finds to the public record. That record tells us something important. Fish kills can happen naturally, from disease, extreme heat or a lack of oxygen. But the fish kills caused by people are far more devastating. About half of the reported events were caused by people, but those events account for more than 90 percent of the fish deaths recorded in the database (see Figure 1, source: IDNR Fish Kill Summaries).
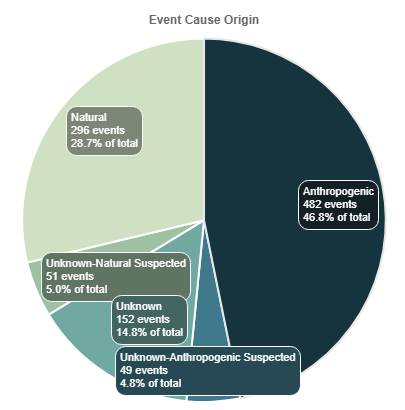
In other words, nature kills Iowa’s fish by the hundreds; people kill them by the thousands.
The database gives us a way to see those patterns. It also gives Iowans an opportunity to respond. By looking at the cause, where fish kills reoccur, and how many fish they destroy, we can identify preventable risks, hold polluters accountable, and reduce the likelihood that the next spill becomes another entry in the database.
Two causes do most of the damage
Of the 19 causes the DNR tracks, two stand far above the others: animal waste and ammonia fertilizer. Together, they account for 30 percent of all reported fish kills and 79 percent of dead fish (see IDNR’s Summary of Fish Kills in Iowa). Where investigators identified the animal, hogs were the most common source, ahead of dairy cattle. These animal-related events tend to be large for a simple, mechanical reason: a hose breaks, a pump is left running, or a valve is left open. Manure or fertilizer reaches the stream in quantities large enough to make ammonia acutely toxic, or to strip the water of oxygen as the chemical breaks down.
A notable recent event fits the pattern — a valve left open over a weekend at an agricultural co-op in Red Oak in March 2024 emptied 265,000 gallons into the East Nishnabotna and killed more than 749,000 fish. Surprisingly, this event is only the fifth-largest kill on record.
Fish kills follow patterns
The timing of fish kills follows a pattern, too. More than one in four kills — 281 of 1,026 — happened in August, and three-quarters of the list falls between May and September (see Figure 2; source: IDNR Fish Kill Summaries). Water levels tend to be low in August, and it is the warmest month of the year. Warmer water holds less dissolved oxygen, and the end of the summer months is when fish need the most oxygen due to their population and growth. Those same conditions — heat and less water to dilute pollutants — make August the most susceptible for both natural and anthropogenic fish kill events. Summer is also when more Iowans are fishing, wading, and paddling, and therefore, more likely to notice a fish kill. The kills are no bigger than any other month’s; there are simply more of them, and more of us to find them.

The kills concentrate in particular places, too. Thirty-nine stream segments have been subject to two or more pollution-caused kills within a single five-year period. McLoud Run in Cedar Rapids is a particularly striking example: a two-and-a-half-mile stretch of cold water beside the interstate and Iowa’s only urban trout stream. It has experienced 13 fish kill events since 1997, usually when a broken drinking water main sent chlorinated tap water into the stream. That is roughly one fish kill every other year for a quarter century, in a stream where people fish inside Iowa’s second-largest city. A public database that can reveal a pattern like that should be more than a historical record. It should be a warning.
What the list cannot tell us
The database also has an important limitation: it records what was reported and investigated, not everything that happened in Iowa’s waters. Reported fish kills have fallen by roughly half, from about 29 investigations per year between 2000 and 2014 to about 14 per year in recent years. There are several ways to interpret this change: Iowa may be experiencing fewer fish kills, which would be good news. On the other hand, it could also mean Iowans are finding fewer kills or reporting them less often. Or some of the small streams that repeatedly appear in the database may have fewer fish left to kill due to previous incidents or stream degradation. More research is needed to determine why shifts are occurring.
Regardless, it is critical that citizens report fish kills to their local DNR field offices immediately. If you see dead fish in a waterbody, take photos and be sure to record your location. The DNR is the only agency with authority to investigate a fish kill, and that process will not be triggered unless someone reports it.
Iowa’s Fish Kill Database is a unique asset for the state, especially because it provides access to more than 40 years of data, but it is not a complete account of what has happened to Iowa’s rivers. It is an account of what Iowans noticed happening to them. Every line on the list exists because somebody looked at the water, recognized that something was wrong, and made a call. That makes the database not only a record of pollution, but a record of citizen vigilance and a tool we can use to make the next fish kill less likely.